Introduction:
The Moving Average Convergence Divergence (MACD) strategy is a powerful tool in the arsenal of professional traders. It offers valuable insights into market trends and generates trading signals.
In this educational article, we will delve deep into how the MACD strategy works and provide essential insights for traders seeking to master this technical analysis tool.
Understanding MACD Components: The MACD strategy relies on three key components:
- MACD Line (Fast Line):
- Calculated by subtracting the 26-period Exponential Moving Average (EMA) from the 12-period EMA.
- This results in a dynamic line that oscillates above and below zero.
- Signal Line (Slow Line):
- Comprises a 9-period EMA of the MACD Line.
- Smooths the MACD Line’s fluctuations and aids in generating trading signals.
- Histogram:
- Represents the difference between the MACD Line and the Signal Line.
- Provides a visual representation of momentum within the trend.
Interpreting MACD Signals: The MACD strategy generates trading signals based on the interactions between the MACD Line and the Signal Line:
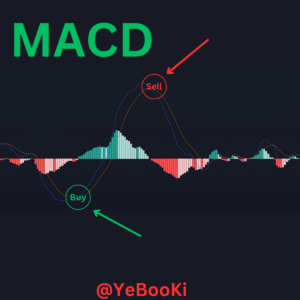
- Bullish Signal: When the MACD Line crosses above the Signal Line, it signals a potential buying opportunity.
- Bearish Signal: Conversely, when the MACD Line crosses below the Signal Line, it indicates a potential selling or shorting opportunity.


Histogram Insights: The histogram within the MACD strategy can offer additional insights:
Bullish Momentum: Histogram bars moving above the zero line and increasing in height suggest growing bullish momentum.
Bearish Momentum: Histogram bars moving below the zero line and decreasing in height indicate increasing bearish momentum.
Divergence Analysis: Professional traders often use MACD to identify trend reversals through divergence:
Bearish Divergence: Occurs when the price makes higher highs while the MACD makes lower highs, signaling a potential trend reversal to the downside.
Bullish Divergence: In contrast, bullish divergence occurs when the price makes lower lows while the MACD makes higher lows, suggesting a potential trend reversal to the upside.

Signal Confirmation: To enhance the reliability of MACD signals, traders often incorporate other technical indicators, consider support and resistance levels,
and conduct additional trend analysis before executing trades.
Risk Management: Sound risk management practices, such as setting stop-loss orders and determining appropriate position sizes based on risk tolerance, are paramount for professional traders using the MACD strategy.
Choosing Timeframes: The MACD strategy is versatile and can be applied across various timeframes, depending on the trader’s style and objectives, from intraday trading to longer-term investing.
Continuous Learning and Backtesting: Professional traders understand the importance of continuous learning and refining their strategies. Backtesting the MACD strategy on historical data helps assess its effectiveness under different market conditions.
Conclusion: In conclusion, the MACD strategy is a valuable tool for professional traders seeking to navigate the financial markets.
While it provides valuable insights and trading signals, it should be used in conjunction with other analysis techniques, and risk management should always be a top priority.
Continuous learning and adaptability are key to mastering this strategy and achieving long-term success in trading.

